In this post I want to explore the pitfalls and working settings for running LLMs locally on an RDNA2 GPU. It mainly focuses on cache quantization but also offers more settings to improve performance and some rambling as well.
Table of Contents
2026-03-28 -> The post was updated with a short description, nicer tables as well as further research into how different model architectures react to mixed quantization, based on a comment on Reddit by user a_beautiful_rhind
Rambling
I've been struggling with running LLMs locally on my AMD Radeon 6950XT. Running "frontier" open-weight models on 16GB VRAM and 32GB RAM is already not the easiest, and a lot of people seem to assume you have more than that. Just recently Mistral released their new Mistral 4 "Small" model at a whopping 120B parameters. At least it's MoE I guess.
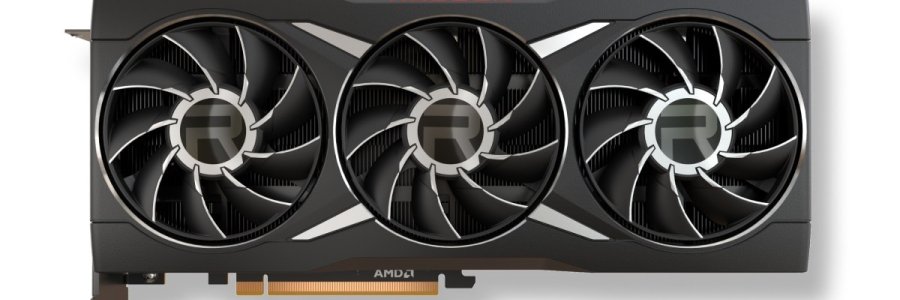
It's not made easier by this generation, which is one of the latest ones that lack both FP8 and matrix calculation acceleration. Just one newer generation and you'd get both! At least the card has a funny name.
The best "bang for the buck" model I've seen so far are either the Qwen 3.5 or similar ones. GLM4.7-Flash-Reap is genuinely one of the fastest models I've run so far. If you trust the posted benchmark numbers though, even Qwen3.5-9B completely smokes it.
Using a finetune for coding called Omnicoder based on Qwen3.5-9B seemed like a nice choice. The only really valid alternatives seem to be Qwen3.5-35B-A3B, Qwen3-Coder-Next or the new Nemotron Cascade 2. The latter two are unreasonably large for my (V)RAM though and Qwen3.5-35B-A3B is awfully sensitive in my testings. I've had many instances where it would just completely run amok.
The 9B Omnicoder seemed like a good fit, as it would comfortably sit in my VRAM along with all the context I'd need and then some. Doing that I've been getting some pretty good numbers like 200 tok/s prompt processing and 20 tok/s token generation. Or so I thought.
Looking on Reddit and other sources, lots of people make it seem like this is a good performance for "low VRAM" setups, which 16GB is in the local LLMs space. It doesn't help that virtually everyone seems to be running Nvidia, specifically Blackwell, or Apple hardware. There's rarely any frame of reference to AMD. One comment I found only had that throughput on the much better AMD Radeon AI Pro 9700, albeit with a bigger model as well. I felt content with the performance I was getting, so to speak.
Cache Quantization
One recurring theme in performance guides on Reddit and otherwhere is KV cache quantization. Quantizing the KV cache can result in significant memory savings and usually insigificant quality loss. But, some models react more sensitively to specific quantizations. Some people thus advise to try different quantizations for key and value in the KV cache. You can easily try this out yourself with -ctv q8_0 -ctk f16. If you know any programming or data engineering this may make sense. It's a lot more important for keys to be unique and specific than it is for the value to be 100% accurate. So it's fine then, shouldn't everyone run with this?
Nope
I was going through the list of options llama.cpp supports. I kept reading "loading ggml-haswell backend" when launching llama.cpp and kept wondering if there's not an option to use a backend for newer CPU archs (like my Zen-3 5950X).
By chance the two options for cache quantization jump out to me again and I begin wondering, isn't it bad to have a differing layout for GPUs?
Benchmarks!
| model | size | params | backend | ngl | n_batch | type_k | type_v | fa | test | t/s |
|---|---|---|---|---|---|---|---|---|---|---|
| qwen35 9B Q6_K | 6.84 GiB | 8.95 B | Vulkan | 99 | 1024 | f16 | q8_0 | 1 | pp5000 | 334.27 ± 1.42 |
| qwen35 9B Q6_K | 6.84 GiB | 8.95 B | Vulkan | 99 | 1024 | f16 | q8_0 | 1 | tg128 | 53.53 ± 0.23 |
| qwen35 9B Q6_K | 6.84 GiB | 8.95 B | Vulkan | 99 | 1024 | q8_0 | q8_0 | 1 | pp5000 | 952.79 ± 0.46 |
| qwen35 9B Q6_K | 6.84 GiB | 8.95 B | Vulkan | 99 | 1024 | q8_0 | q8_0 | 1 | tg128 | 63.37 ± 0.06 |
My standard benchmark run tests a 5000 token prompt as I'm usually using the models for coding, so the default 512 token prompt isn't really representative.
As you can tell, same quantization can double throughput / differing quantization can halve throughput.
But L3tum, isn't
f16just more bandwidth and thus the lower performance can be explained by that?
Good point, but no! Here's the same test with KV cache at f16. As you can see, same performance as non-quantized.
| model | size | params | backend | ngl | n_batch | fa | test | t/s |
|---|---|---|---|---|---|---|---|---|
| qwen35 9B Q6_K | 6.84 GiB | 8.95 B | Vulkan | 99 | 1024 | 1 | pp5000 | 951.76 ± 0.30 |
| qwen35 9B Q6_K | 6.84 GiB | 8.95 B | Vulkan | 99 | 1024 | 1 | tg128 | 63.49 ± 0.02 |
What about other models?
After a Reddit user pointed me towards benchmarking those as well, here's the results for a few different models I had laying around.
GLM4.7-Flash Reap
This model is a little weird, in that it seems fine with mixed quantization for values, but destroys itself on any quantization that touches keys. It was running right at the maximum of VRAM though, so may have been an issue.
| model | size | params | backend | ngl | n_batch | type_k | type_v | fa | test | t/s |
|---|---|---|---|---|---|---|---|---|---|---|
| deepseek2 30B.A3B Q4_K - Medium | 13.14 GiB | 23.00 B | Vulkan | 99 | 1024 | q8_0 | q8_0 | 1 | pp5000 | 137.42 ± 0.21 |
| deepseek2 30B.A3B Q4_K - Medium | 13.14 GiB | 23.00 B | Vulkan | 99 | 1024 | q8_0 | q8_0 | 1 | tg128 | 107.44 ± 0.06 |
| deepseek2 30B.A3B Q4_K - Medium | 13.14 GiB | 23.00 B | Vulkan | 99 | 1024 | q8_0 | f16 | 1 | pp5000 | 137.73 ± 0.17 |
| deepseek2 30B.A3B Q4_K - Medium | 13.14 GiB | 23.00 B | Vulkan | 99 | 1024 | q8_0 | f16 | 1 | tg128 | 107.36 ± 0.03 |
| deepseek2 30B.A3B Q4_K - Medium | 13.14 GiB | 23.00 B | Vulkan | 99 | 1024 | f16 | q8_0 | 1 | pp5000 | 289.24 ± 0.18 |
| deepseek2 30B.A3B Q4_K - Medium | 13.14 GiB | 23.00 B | Vulkan | 99 | 1024 | f16 | q8_0 | 1 | tg128 | 118.25 ± 0.09 |
| deepseek2 30B.A3B Q4_K - Medium | 13.14 GiB | 23.00 B | Vulkan | 99 | 1024 | f16 | f16 | 1 | pp5000 | 289.08 ± 0.37 |
| deepseek2 30B.A3B Q4_K - Medium | 13.14 GiB | 23.00 B | Vulkan | 99 | 1024 | f16 | f16 | 1 | tg128 | 118.30 ± 0.08 |
Phi 4 Mini Instruct
This one seems to support my Qwen3.5 theory in that it gets destroyed in mixed quantization and is fine in either full quantization or no quantization. Notably quantization here does offer a little bit of performance advantage over no quantization.
| model | size | params | backend | ngl | n_batch | type_k | type_v | fa | test | t/s |
|---|---|---|---|---|---|---|---|---|---|---|
| phi3 3B Q8_0 | 3.80 GiB | 3.84 B | Vulkan | 99 | 1024 | q8_0 | q8_0 | 1 | pp5000 | 692.43 ± 0.17 |
| phi3 3B Q8_0 | 3.80 GiB | 3.84 B | Vulkan | 99 | 1024 | q8_0 | q8_0 | 1 | tg128 | 115.99 ± 0.03 |
| phi3 3B Q8_0 | 3.80 GiB | 3.84 B | Vulkan | 99 | 1024 | q8_0 | f16 | 1 | pp5000 | 169.72 ± 0.81 |
| phi3 3B Q8_0 | 3.80 GiB | 3.84 B | Vulkan | 99 | 1024 | q8_0 | f16 | 1 | tg128 | 51.15 ± 0.21 |
| phi3 3B Q8_0 | 3.80 GiB | 3.84 B | Vulkan | 99 | 1024 | f16 | q8_0 | 1 | pp5000 | 113.79 ± 0.51 |
| phi3 3B Q8_0 | 3.80 GiB | 3.84 B | Vulkan | 99 | 1024 | f16 | q8_0 | 1 | tg128 | 48.94 ± 3.93 |
| phi3 3B Q8_0 | 3.80 GiB | 3.84 B | Vulkan | 99 | 1024 | f16 | f16 | 1 | pp5000 | 628.43 ± 0.81 |
| phi3 3B Q8_0 | 3.80 GiB | 3.84 B | Vulkan | 99 | 1024 | f16 | f16 | 1 | tg128 | 115.77 ± 0.45 |
IQuestCoder-14B
This one's a fairly old model I accidentally downloaded a while back cause it showed up with many downloads on HuggingFace. Same behaviour as Phi4 (or Phi3) though.
| model | size | params | backend | ngl | n_batch | type_k | type_v | fa | test | t/s |
|---|---|---|---|---|---|---|---|---|---|---|
| llama 3B Q6_K | 11.03 GiB | 14.44 B | Vulkan | 99 | 1024 | q8_0 | q8_0 | 1 | pp5000 | 323.06 ± 0.09 |
| llama 3B Q6_K | 11.03 GiB | 14.44 B | Vulkan | 99 | 1024 | q8_0 | q8_0 | 1 | tg128 | 45.02 ± 0.01 |
| llama 3B Q6_K | 11.03 GiB | 14.44 B | Vulkan | 99 | 1024 | q8_0 | f16 | 1 | pp5000 | 101.46 ± 0.37 |
| llama 3B Q6_K | 11.03 GiB | 14.44 B | Vulkan | 99 | 1024 | q8_0 | f16 | 1 | tg128 | 30.99 ± 0.21 |
| llama 3B Q6_K | 11.03 GiB | 14.44 B | Vulkan | 99 | 1024 | f16 | q8_0 | 1 | pp5000 | 69.65 ± 0.21 |
| llama 3B Q6_K | 11.03 GiB | 14.44 B | Vulkan | 99 | 1024 | f16 | q8_0 | 1 | tg128 | 30.81 ± 0.36 |
| llama 3B Q6_K | 11.03 GiB | 14.44 B | Vulkan | 99 | 1024 | f16 | f16 | 1 | pp5000 | 295.63 ± 0.15 |
| llama 3B Q6_K | 11.03 GiB | 14.44 B | Vulkan | 99 | 1024 | f16 | f16 | 1 | tg128 | 45.20 ± 0.04 |
Devstral Small 2
One of the most used models for coding assistance. Also shows the same effect.
| model | size | params | backend | ngl | n_batch | type_k | type_v | fa | test | t/s |
|---|---|---|---|---|---|---|---|---|---|---|
| mistral3 14B IQ4_XS - 4.25 bpw | 11.89 GiB | 23.57 B | Vulkan | 99 | 1024 | q8_0 | q8_0 | 1 | pp5000 | 199.11 ± 0.08 |
| mistral3 14B IQ4_XS - 4.25 bpw | 11.89 GiB | 23.57 B | Vulkan | 99 | 1024 | q8_0 | q8_0 | 1 | tg128 | 31.42 ± 0.03 |
| mistral3 14B IQ4_XS - 4.25 bpw | 11.89 GiB | 23.57 B | Vulkan | 99 | 1024 | q8_0 | f16 | 1 | pp5000 | 81.42 ± 0.47 |
| mistral3 14B IQ4_XS - 4.25 bpw | 11.89 GiB | 23.57 B | Vulkan | 99 | 1024 | q8_0 | f16 | 1 | tg128 | 21.30 ± 0.12 |
| mistral3 14B IQ4_XS - 4.25 bpw | 11.89 GiB | 23.57 B | Vulkan | 99 | 1024 | f16 | q8_0 | 1 | pp5000 | 58.67 ± 0.11 |
| mistral3 14B IQ4_XS - 4.25 bpw | 11.89 GiB | 23.57 B | Vulkan | 99 | 1024 | f16 | q8_0 | 1 | tg128 | 21.18 ± 0.08 |
| mistral3 14B IQ4_XS - 4.25 bpw | 11.89 GiB | 23.57 B | Vulkan | 99 | 1024 | f16 | f16 | 1 | pp5000 | 188.07 ± 0.08 |
| mistral3 14B IQ4_XS - 4.25 bpw | 11.89 GiB | 23.57 B | Vulkan | 99 | 1024 | f16 | f16 | 1 | tg128 | 31.37 ± 0.04 |
Explanations?
Running more models made me check out my system utilization as well and made me notice that my CPU usage spikes to 66% and my GPU falls flat when mixed quantization is used and the performance craters. I think it's kind of impressive that my 5950X can still run prompt processing at that speed.
Though this does point towards a missing optimization in the Vulkan backend for llama.cpp when it comes to mixed quantization. It would be cool if other people using other backends could re-run the tests to see what is and is not affected.
66% of my 32-thread 5950X is roughly 24 threads that are being used. Not sure if that's a default in llama.cpp or some bottleneck elsewhere in the system.
Other settings that matter
My full "performance optimization" for my card:
-fa on --prio -1 --parallel 1 --batch-size 1024 --ubatch-size 1024 -ctv q8_0 -ctk q8_0
Here's a breakdown for the different options:
- -fa on -> Flash Attention. Used to be the case that some models didn't like it, but nowadays can basically be always on for a nice speed boost
- --prio -1 -> Sets process priority for llama-server to -1 (less than normal). This make everything else like windows or CLIs still responsive rather than freezing your desktop
- --parallel 1 -> Theoretically llama-server should already only launch one client-slot and not allocate more context than for that one client, but some report setting it explicitly increases performance
- --batch-size 1024 --ubatch-size 1024 -> Sets the batch size for processing and memory allocation. In my testing there's no change in throughput from 512 to 4096, but 1024 is more stable than 512. Lower values are slower
- -ctv q8_0 -ctk q8_0 -> KV Cache quantization. You can theoretically leave it at
f16(default) for the 9B since it should fit into VRAM
Bonus llama.cpp version recommendation
The best version so far seems to be b8416. I've had some issues with versions after this as of today (2026-03-23) but YMMV.